

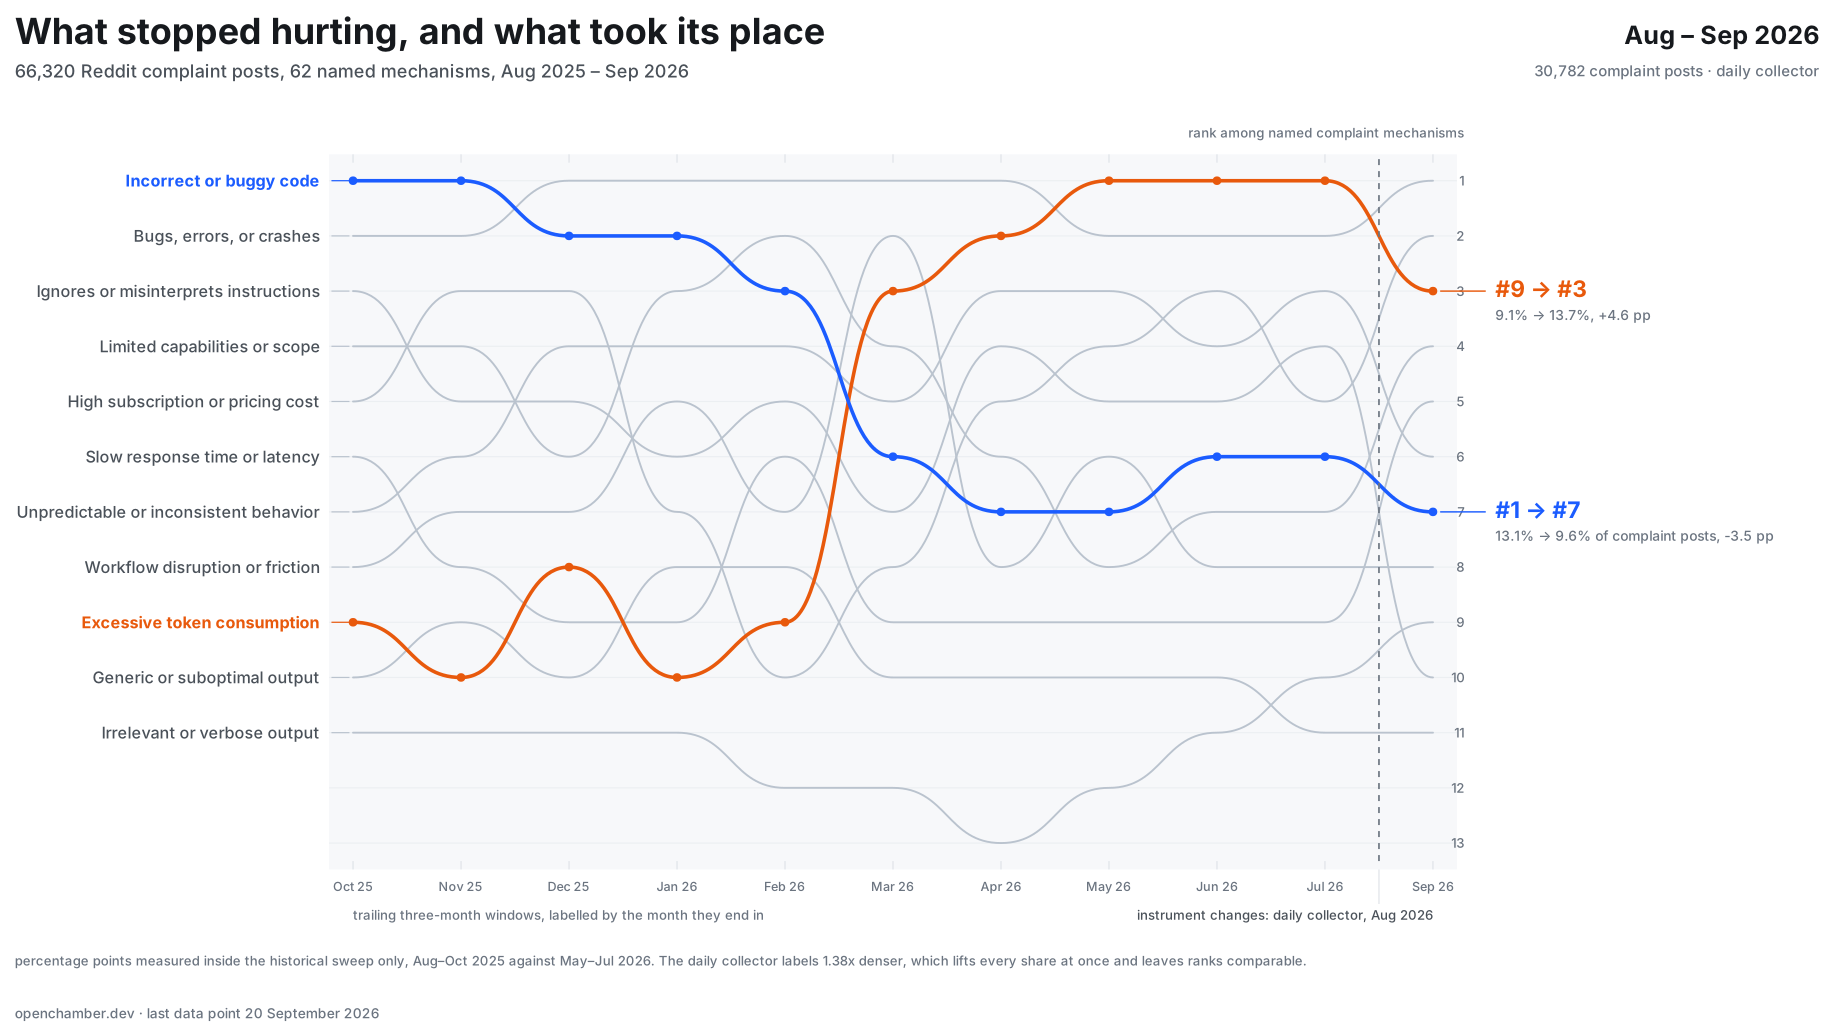
Between August 2025 and September 2026 the most common complaint about AI coding agents stopped being “it wrote the wrong code”. That complaint fell from first place to seventh. The complaint that replaced it near the top is the bill: token consumption moved from ninth to third. The model got better. The meter got worse.
This is a measurement, not an impression. It comes from 66,320 Reddit posts in which somebody stated a problem with an AI coding tool, labelled into 62 named mechanisms, counted month by month for thirteen full months and the first twenty days of September. The last data point in this article is 20 September 2026.
Where we stand. We are OpenChamber, an open-source agentic development environment, and we are not a neutral party here. Several of the tools counted below compete with us, and opencode, which appears in the tables, is the project ours is built on. We are not in the tables ourselves, and not by choice: our own product is named in seven complaint posts in the late year-over-year window and six in the current one, against a floor of 150 posts for a year-over-year reading and 121 for the smallest tool in the current-window tables. That is too little to measure, so we appear nowhere below and we make no claim about ourselves either way. Nothing below is drawn from our product. The data is public Reddit posts, the full taxonomy is in the appendix, and the method note at the end lists every way this can mislead you.
The short version
| Complaint posts read and labelled | 66,320 across 14 months |
| Labelled complaint phrases | 422,317 distinct phrases, 209,010 of them labelled for this article |
| Biggest single fall | Incorrect or buggy code, 13.1% to 9.6% of complaint posts (-3.5 pp) |
| Biggest single rise | Excessive token consumption, 9.1% to 13.7% (+4.6 pp) |
| Fastest riser from a small base | Security risks from running the agent, 1.2% to 2.9% (x2.4) |
| Complaint group that shrank most | Output quality and correctness, 49.4% to 44.2% (-5.2 pp) |
| Complaint group that grew most | Security and privacy, 6.2% to 9.7% (+3.5 pp) |
| Rank change, wrong code | #1 a year ago, #7 now |
| Rank change, token cost | #9 a year ago, #3 now |
Everything below is that sentence, unpacked and sourced.
What we measured, and with what
We keep two continuous datasets about this market. Both are ours, both count rather than sample, and they were collected by different instruments. That difference matters enough that we describe it before any number.
Instrument one, the history. A keyword sweep of 2,054 search terms across Reddit, de-duplicated by URL, extracted from the post title and body. It runs from before 2024 to 3 August 2026. Within the window of this article, August 2025 to July 2026, it contributes 35,538 posts that state a complaint.
Instrument two, the present. A daily collector that has been running since August 2026. It takes new posts every morning through the Arctic Shift index rather than through Reddit search, and it extracts from the whole thread. In the window 1 August to 20 September 2026 it holds 71,655 on-topic posts, 60,252 of which state a complaint. 30,782 of those go into the series here, after the filters described below.
The two instruments do not read the world the same way. On the three days both of them cover, 1 to 3 August 2026, the daily collector attaches 3.61 complaint categories to a post where the historical sweep attaches 2.61. That is a factor of 1.38, and it inflates every share in the newer data by roughly that much. So:
- All year-over-year percentage-point movements in this article are measured inside the historical instrument only, comparing August to October 2025 against May to July 2026. No cross-instrument arithmetic.
- The present-day section uses the daily collector and reports ranks and levels, not deltas against last year. Ranks survive the density difference because it lifts every category at once.
- Where a direction flips depending on which method you use, we say so and claim nothing.
What we threw out, and why you should care
A data article is only as honest as its exclusions, so here are ours.
Two subreddits that are not conversations. r/ClaudeWorkflows and r/ClaudeCodeTLDR are mirrors: posts scored 1, no comments, bodies that summarise other people’s material. Together they are 2,675 posts, 4.4% of the complaint posts in the current window. What the extractor pulls out of them is a complaint about the post rather than about a tool: no community validation yet due to the post’s recency, the post doesn’t provide detailed examples. Nothing about their volume gives them away — 4.0 extracted phrases per post against 3.9 everywhere else — so they only look wrong once you read what the phrases say. Left in, they inflate precisely the categories that describe a post: complaints that nobody in the community responded run at 6.5 times their year-ago level with the mirrors in and 2.2 times without them, and inadequate documentation at 1.5 times against 1.1. They are excluded from every count here.
Self-promotion. 13,319 posts in the recent window announce a product. Their “pain points” are marketing copy about problems the product claims to solve, and they cluster in repeated series. They are excluded from every count.
Labelling density. The extractor got more thorough over time: 2.5 categories per post in autumn 2025, 3.1 in mid-2026, inside the same instrument. That inflates all shares slightly, so alongside the share of complaint posts we also track composition, each category’s share of all category hits, which cancels density by construction. A movement is only reported here if it holds in both.
Reposts. Identical normalised summaries are collapsed to the earliest post, so a thread cross-posted to five subreddits counts once.
What we did not throw out: posts that criticise a tool we compete with, posts that praise one, and posts about our own product. There is no whitelist of topics.
One number to distrust
Between the two windows, complaints we cannot name grew from 9.8% to 13.1% of posts. That is the taxonomy aging. It was built on the language of mid-2026, and by September a growing minority of complaints do not fit any of its 62 leaves. We report the growth rather than hiding it, and we do not treat “other” as a finding.
The model got better
Every category that describes the model failing at its job fell.
| Complaint | Aug-Oct 2025 | May-Jul 2026 | Change |
|---|---|---|---|
| Incorrect or buggy code | 13.1% | 9.6% | -3.5 pp |
| Limited context window | 6.0% | 4.4% | -1.6 pp |
| Slow response or latency | 10.3% | 8.7% | -1.6 pp |
| Limited capabilities or scope | 10.7% | 9.5% | -1.2 pp |
| Tooling or IDE incompatibility | 4.0% | 2.9% | -1.1 pp |
| Ignores or misinterprets instructions | 11.1% | 10.1% | -1.0 pp |
| Missing or incomplete features | 5.4% | 4.4% | -1.0 pp |
| Generic or suboptimal output | 8.8% | 8.0% | -0.8 pp |
| Bugs, errors or crashes | 12.2% | 11.5% | -0.7 pp |
| Setup or integration difficulties | 3.1% | 2.4% | -0.7 pp |
Read the first row twice. A year ago, the single most common thing people wrote about AI coding agents was that the code was wrong. Today that complaint is a third less frequent, and in the freshest data it sits in seventh place.
The whole group behaves the same way. Output quality and correctness fell 5.2 points, from 49.4% of complaint posts to 44.2%, the largest group movement in the dataset in either direction. Integration and user experience fell 3.3 points: installing the thing, wiring it to an editor, and getting it to run stopped being what people write about.
Two more falls belong here, and both are quiet retirements of arguments that used to fill threads. Context window complaints fell 1.6 points as the ceilings moved. Latency fell 1.6 points, which is worth noticing because agents in 2026 do far more work per request than they did in 2025, and people still complain about waiting less often than they used to.
None of this says the code is correct. Hallucination is flat, and “unpredictable or inconsistent behaviour” actually rose slightly, to 10.8%. It says the failure that dominated the conversation a year ago no longer dominates it.
The meter got worse
Here is the other half of the year.
| Complaint | Aug-Oct 2025 | May-Jul 2026 | Change |
|---|---|---|---|
| Excessive token consumption and cost of a run | 9.1% | 13.7% | +4.6 pp |
| Lack of user control or autonomy | 4.8% | 6.9% | +2.1 pp |
| Security risks from running the agent | 1.2% | 2.9% | +1.7 pp |
| Inefficient processing or wasteful workflow | 4.6% | 6.3% | +1.7 pp |
| High resource consumption that is not tokens | 1.8% | 3.5% | +1.7 pp |
| Hardware or infrastructure constraints | 1.7% | 3.0% | +1.3 pp |
| Undesirable model traits | 4.2% | 5.2% | +1.0 pp |
| Vulnerabilities in generated code | 2.8% | 3.8% | +1.0 pp |
| Data privacy or exposure risk | 2.1% | 3.0% | +0.9 pp |
| No visibility into what the agent is doing | 2.2% | 3.0% | +0.8 pp |
| Irrelevant or verbose output | 7.8% | 8.5% | +0.7 pp |
| Service downtime or unavailability | 2.2% | 2.9% | +0.7 pp |
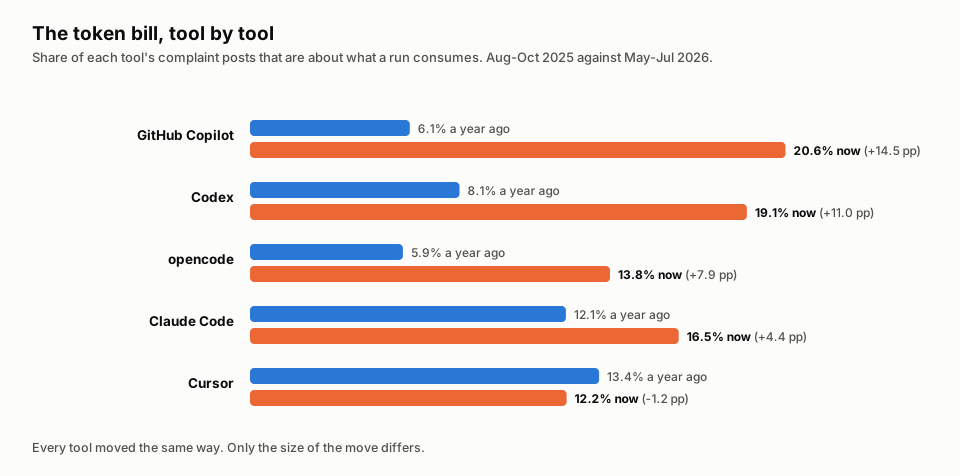
The single largest rise in the dataset is the cost of a run. Not the price of a subscription, which we treat separately below, but the amount of machine the agent consumes to do a piece of work. In the historical instrument it went from one complaint post in eleven to more than one in eight, and in the freshest data it is the third most common complaint of all.
Three of these rows are the same story told from different angles. Token consumption is the bill. “Inefficient processing or wasteful workflow” is watching the agent take eleven steps to do three. “Irrelevant or verbose output” is being handed nine hundred lines when you asked for a fix, and then having to read them.
“The ‘fix-up’ step can quietly eat all your savings. A powerful model like Opus will often rewrite the cheaper model’s perfectly valid code just because it’s not in its preferred style, costing you more in the end.”
“It’s great but my god it’s so effing bloated. A simple Hi would cost me 12k tokens at my least. At my worst it was 24k.”
The reason this pairing matters is that the two halves are not independent. The model got good enough to be given bigger jobs, agents were handed more autonomy to do those jobs, and the cost of a mistake changed shape. A wrong function used to cost you a re-prompt. An unsupervised loop costs you money while it works, and it can work for a long time.
The money complaint changed shape
This is the finding that surprised us, and it is the one we would ask a sceptical reader to check first.
| Money complaint | Aug-Oct 2025 | May-Jul 2026 | Change |
|---|---|---|---|
| Excessive token consumption (what a run costs) | 9.1% | 13.7% | +4.6 pp |
| High subscription or pricing cost (what the plan costs) | 10.4% | 9.8% | -0.6 pp |
| Strict or aggressive rate limits | 6.5% | 5.8% | -0.7 pp |
| Lack of pricing transparency | 2.6% | 2.1% | -0.5 pp |
People did not get louder about prices. They got louder about consumption. “Your plan is expensive” is flat to slightly down across the year, while “this thing burns through what I bought” is up by nearly half. The cost group as a whole rose 2.7 points, and all of that rise and more comes from the consumption row.
That is a different complaint with different consequences. A price complaint is answered by a discount, and it points at the vendor. A consumption complaint is answered by control, and it points at whatever is driving the agent: which model got picked, how much context was re-sent, how many subagents were spawned, whether a loop was allowed to run unattended. It is the difference between “this is too expensive” and “I cannot see where my money went”.
The transparency row backs that reading. “No visibility into what the agent is doing” rose 0.7 points from a small base, and the posts underneath it are not abstract.
“I’m not saying Anthropic was purposely trying to ‘scam’ me but Claude switching to API use on its own without asking should NOT ever happen.”
“Opencode Go made a unilateral change to the contract. They altered limits without prior notice and charged me for a plan that will never deliver what was promised.”
Go was opencode’s paid tier, not a separate product; it was withdrawn later in August.
Both of those are about a meter the user does not control and cannot audit, not about a number on a pricing page.
When it turned
The year did not move smoothly. Both of the big shifts have a month where they start, and the two months are close together.
Every cell is the share of that month’s complaint posts that carry this complaint, in per cent. A column does not sum to 100: one post can carry several complaints. The first twelve months come from the historical instrument and the last two from the daily one, so the seam is marked and the two sides are not subtracted from each other. Bold marks the month a row steps to a new level and stays there. September covers twenty days.
| Complaint, % of posts | Aug 25 | Sep 25 | Oct 25 | Nov 25 | Dec 25 | Jan 26 | Feb 26 | Mar 26 | Apr 26 | May 26 | Jun 26 | Jul 26 | Aug 26 | Sep 26 | |
|---|---|---|---|---|---|---|---|---|---|---|---|---|---|---|---|
| Excessive token consumption | 9.0 | 7.0 | 10.9 | 8.6 | 9.0 | 8.4 | 10.7 | 11.8 | 13.6 | 13.5 | 14.0 | 13.5 | 11.4 | 9.0 | |
| Incorrect or buggy code | 12.0 | 15.6 | 11.9 | 11.2 | 12.5 | 10.1 | 10.0 | 10.1 | 9.9 | 10.1 | 9.2 | 9.7 | 10.9 | 7.3 | |
| Lack of user control | 3.6 | 6.1 | 4.8 | 6.5 | 5.7 | 6.0 | 6.3 | 6.3 | 5.8 | 6.8 | 7.2 | 6.8 | 6.2 | 4.5 | |
| Security risks from the agent | 1.1 | 1.5 | 1.0 | 1.5 | 2.0 | 2.5 | 3.5 | 3.2 | 2.5 | 2.8 | 2.5 | 3.2 | 2.9 | 2.4 | |
| Hardware or infrastructure | 1.6 | 1.4 | 2.0 | 2.1 | 2.5 | 2.2 | 3.1 | 2.4 | 2.2 | 3.0 | 3.6 | 2.7 | 4.8 | 2.5 | |
| Slow response or latency | 11.8 | 10.2 | 9.1 | 8.3 | 9.1 | 9.8 | 10.1 | 9.0 | 9.2 | 9.4 | 8.7 | 8.4 | 11.6 | 6.2 | |
| Limited context window | 7.8 | 5.8 | 4.6 | 4.3 | 6.3 | 5.8 | 5.3 | 6.0 | 4.6 | 4.9 | 4.9 | 3.8 | 4.7 | 2.5 | |
| Strict or aggressive rate limits | 6.3 | 6.8 | 6.5 | 5.4 | 4.4 | 6.1 | 6.2 | 8.1 | 8.5 | 6.8 | 5.4 | 5.6 | 5.7 | 5.0 | |
| High subscription or pricing cost | 9.2 | 8.6 | 12.9 | 11.7 | 8.6 | 9.2 | 10.1 | 9.3 | 11.8 | 10.9 | 10.8 | 8.8 | 12.2 | 8.0 | |
| Complaint posts that month | 973 | 990 | 1135 | 1183 | 1217 | 1624 | 2270 | 2820 | 3676 | 3926 | 5935 | 9789 | 22339 | 8443 |
The table is fourteen months wide — scroll it sideways for the 2026 columns. The last row is a count, not a share: it is how many complaint posts that month rests on.
Wrong code steps down in January 2026 and never returns. Before that month it sits between 11.2% and 15.6%; from January on it lives between 9.2% and 10.1%. That is not a drift, it is a step, and it lines up with a model generation rather than with anything about the tools.
Token consumption starts climbing in February 2026 and levels off in April at around 13.5%, where it has stayed for four months. So the two headline movements of the year happen within roughly sixty days of each other, in the order you would expect: the model gets good enough to be trusted with more, and the cost of trusting it with more shows up one quarter later.
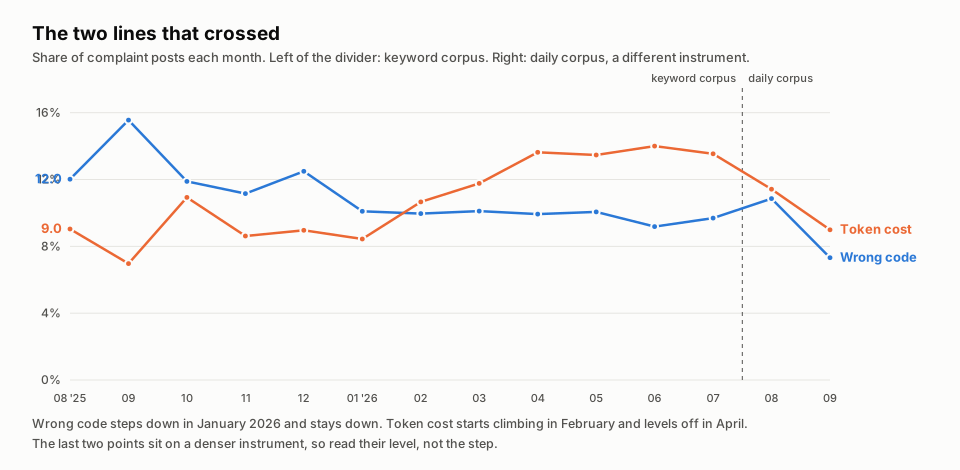
The rate limit row is a useful control. It has a clear spike in March and April 2026, exactly when several vendors tightened caps, and then it returns to its earlier level. That is what a genuine event looks like in this data: a sharp rise, a peak, a return. Neither of the two big movements looks like that. They look like a floor moving.
Do not read the last column as a trend. Twenty days of September, on a different instrument and with the month still open, is a data point rather than a direction.
Control moved from a preference to a complaint
A year ago, autonomy was mostly discussed as a feature request. Now it appears as a defect.
“Lack of user control or autonomy” rose 2.1 points to 6.9%, the second largest rise in the dataset, and it moved from 22nd to 15th place in the ranking. Around it, a cluster of related mechanisms moved the same way: undesirable model traits up 1.0, overconfidence with no self-correction up 0.5, no visibility into internal workings up 0.7. The whole group of instruction following and control rose 3.0 points, to 39.2% of complaint posts.
Note what did not rise inside that group. “Ignores or misinterprets instructions”, the classic complaint about a model that will not listen, fell 1.0 point. The problem is not that the agent misunderstands the instruction. The problem is that it understands, proceeds, and cannot be stopped, inspected or reined in while it does.
The layer breakdown says the same thing from another direction. We label every complaint by what it is aimed at.
| What the complaint is aimed at | Aug-Oct 2025 | May-Jul 2026 | Change |
|---|---|---|---|
| The agent itself (harness, behaviour, UI) | 59.0% | 59.5% | +0.5 pp |
| The underlying model | 39.4% | 38.3% | -1.1 pp |
| Vendor commercial policy (price, quota, billing, outage) | 31.1% | 33.6% | +2.5 pp |
| The user’s own side (process, skills, hardware) | 20.9% | 22.2% | +1.3 pp |
| Ecosystem (MCP, plugins, integrations) | 8.2% | 6.6% | -1.6 pp |
| Undetermined | 8.8% | 11.7% | +2.9 pp |
The model layer is the only one that fell. Vendor policy grew the most. Shares sum above 100% because a post can aim at more than one layer.
Security stopped being a hypothetical
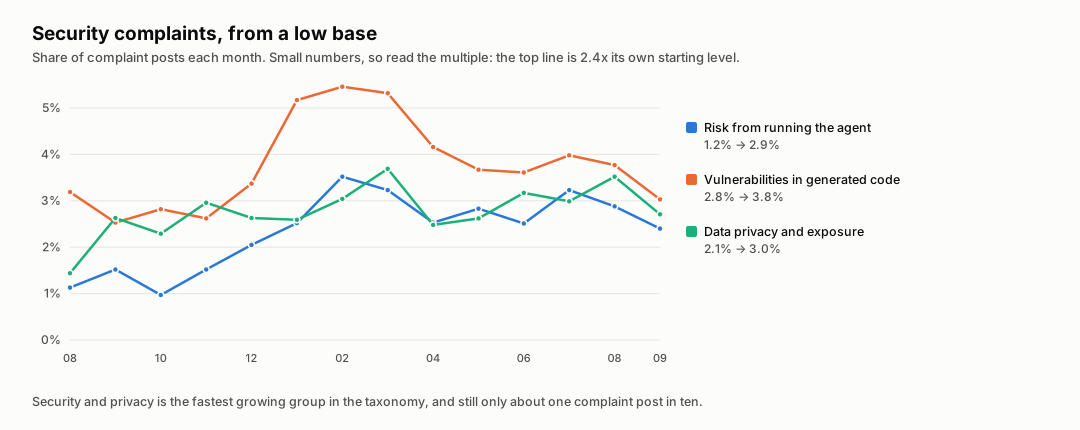
Three separate categories in our taxonomy touch security, and all three rose faster than the dataset average from a low base.
| Security complaint | Aug-Oct 2025 | May-Jul 2026 | Change | Multiple |
|---|---|---|---|---|
| Risks created by running the agent (access, execution) | 1.2% | 2.9% | +1.7 pp | x2.4 |
| Vulnerabilities in the code it generates | 2.8% | 3.8% | +1.0 pp | x1.4 |
| Data privacy or exposure risk | 2.1% | 3.0% | +0.9 pp | x1.4 |
| Group total | 6.2% | 9.7% | +3.5 pp | x1.6 |
Security and privacy is the fastest growing group in the taxonomy. It is still small in absolute terms, roughly one complaint post in ten, and that is exactly why the multiple matters more than the level.
The nature of the posts changed along with the count. In 2025 the security complaint was mostly about the code: the model wrote SQL string concatenation, the model hardcoded a key. In 2026 a second kind arrives, about the agent as a process with credentials on a real machine.
“Instead, it created the backup in the wrong directory and then proceeded to ‘rm -rf’ my entire drive.”
“If you hired a new social media intern would you let that person use your computer and have all your logins? No, just the socials. If you hired a new Chief of Staff? No, but probably virtually almost everything else.”
One caution before anyone builds a slide out of this. Our earlier keyword work found that search demand for agent security is tiny: six keywords, about 2,400 searches a month, against thousands of Reddit posts on the subject. People argue about this constantly and almost never search for it. Treat the rise as a change in what practitioners worry about, not as evidence of a market anyone is currently shopping for.
The hardware line
The two fastest movers you would not have predicted are both about physical machines.
| Complaint | Aug-Oct 2025 | May-Jul 2026 | Change | Rank |
|---|---|---|---|---|
| High resource consumption that is not tokens | 1.8% | 3.5% | +1.7 pp | #43 to #29 |
| Hardware or infrastructure constraints | 1.7% | 3.0% | +1.3 pp | #45 to #23 |
“Hardware or infrastructure constraints” is the single largest rank climb in the dataset, twenty-two places. The posts underneath are about RAM, VRAM, quantisation, thermal throttling, and what a 32 GB laptop can actually hold. They come disproportionately from the local-model communities, and those communities grew inside our corpus at the same time: r/LocalLLM went from 0.8% of complaint posts to 3.4%.
This is the local-model wave arriving as a support problem. When the answer to an expensive meter is “run it yourself”, the complaint does not disappear, it changes address: from the vendor’s bill to your own machine.
Where it stands right now
The section above compares two windows inside one instrument, and it stops in July. This section uses the daily collector and covers 1 August to 20 September 2026, 30,782 complaint posts, which is ten times the whole of the previous autumn.
Because the two instruments differ in density, the honest comparison here is rank, not percentage points. Rank is robust to an effect that lifts every category at once.
| Rank now | Complaint | Share now | Rank a year ago | Share then |
|---|---|---|---|---|
| 1 | Bugs, errors or crashes | 11.4% | 2 | 12.2% |
| 2 | High subscription or pricing cost | 11.1% | 5 | 10.4% |
| 3 | Excessive token consumption | 10.8% | 9 | 9.1% |
| 4 | Limited capabilities or scope | 10.2% | 4 | 10.7% |
| 5 | Slow response or latency | 10.1% | 6 | 10.3% |
| 6 | Unpredictable or inconsistent behaviour | 10.1% | 7 | 10.2% |
| 7 | Incorrect or buggy code | 9.9% | 1 | 13.1% |
| 8 | Workflow disruption or friction | 9.2% | 8 | 9.6% |
| 9 | Irrelevant or verbose output | 9.1% | 11 | 7.8% |
| 10 | Ignores or misinterprets instructions | 8.8% | 3 | 11.1% |
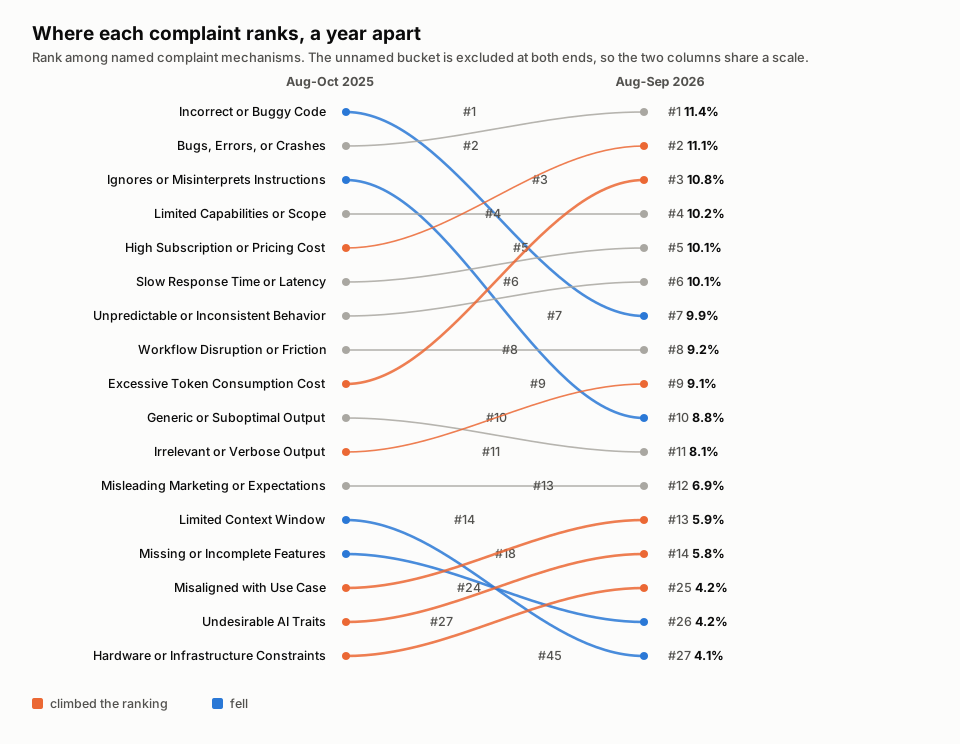
Both rankings exclude the unnamed bucket, on both ends of the year, so the two columns are on the same scale. That bucket is the largest single group in the recent window at 17.3%, and it is discussed further down.
The biggest climbers and fallers by rank:
| Complaint | A year ago | Now | Move |
|---|---|---|---|
| Hardware or infrastructure constraints | #45 | #25 | +20 |
| Undesirable model traits | #27 | #14 | +13 |
| High resource consumption that is not tokens | #43 | #30 | +13 |
| Misaligned with the use case | #24 | #13 | +11 |
| Security risks from running the agent | #54 | #43 | +11 |
| Inefficient processing or wasteful workflow | #25 | #16 | +9 |
| Lack of user control or autonomy | #22 | #15 | +7 |
| Excessive token consumption | #9 | #3 | +6 |
| Loses context or short-term memory | #17 | #22 | -5 |
| Incorrect or buggy code | #1 | #7 | -6 |
| Ignores or misinterprets instructions | #3 | #10 | -7 |
| Missing or incomplete features | #18 | #26 | -8 |
| Stuck in loops or repetitive behaviour | #30 | #40 | -10 |
| Limited context window | #14 | #27 | -13 |
Two of these deserve a note. Rate limits and quota walls both fell in rank, which reads oddly next to a year in which usage limits were a running scandal. The explanation is in the previous section: the complaint moved from the vendor’s cap to the agent’s appetite. And “limited context window” losing twelve places is the clearest single sign that a constraint people organised their whole workflow around in 2025 has largely been engineered away.
Every tool’s pain changed shape
The year-over-year numbers below come from the historical instrument, comparing the same two windows as before, for tools with enough volume in both. A tool’s own share of complaint posts is not a quality score. Popular tools accumulate more complaints, and a tool with a small, patient community accumulates fewer.
A row appears below only when the movement clears that tool’s own noise floor, the 95% interval on a difference of two shares: 1.96 * sqrt(p0(1-p0)/n0 + p1(1-p1)/n1). The floor depends on how many posts the tool has, and it is wide: ±2.5 pp for Claude Code, ±4.8 pp for Copilot, both measured at a 10% share. Tools with fewer than 150 complaint posts in the early window get no year-over-year reading at all, because at that size the floor swallows every shift worth reporting.
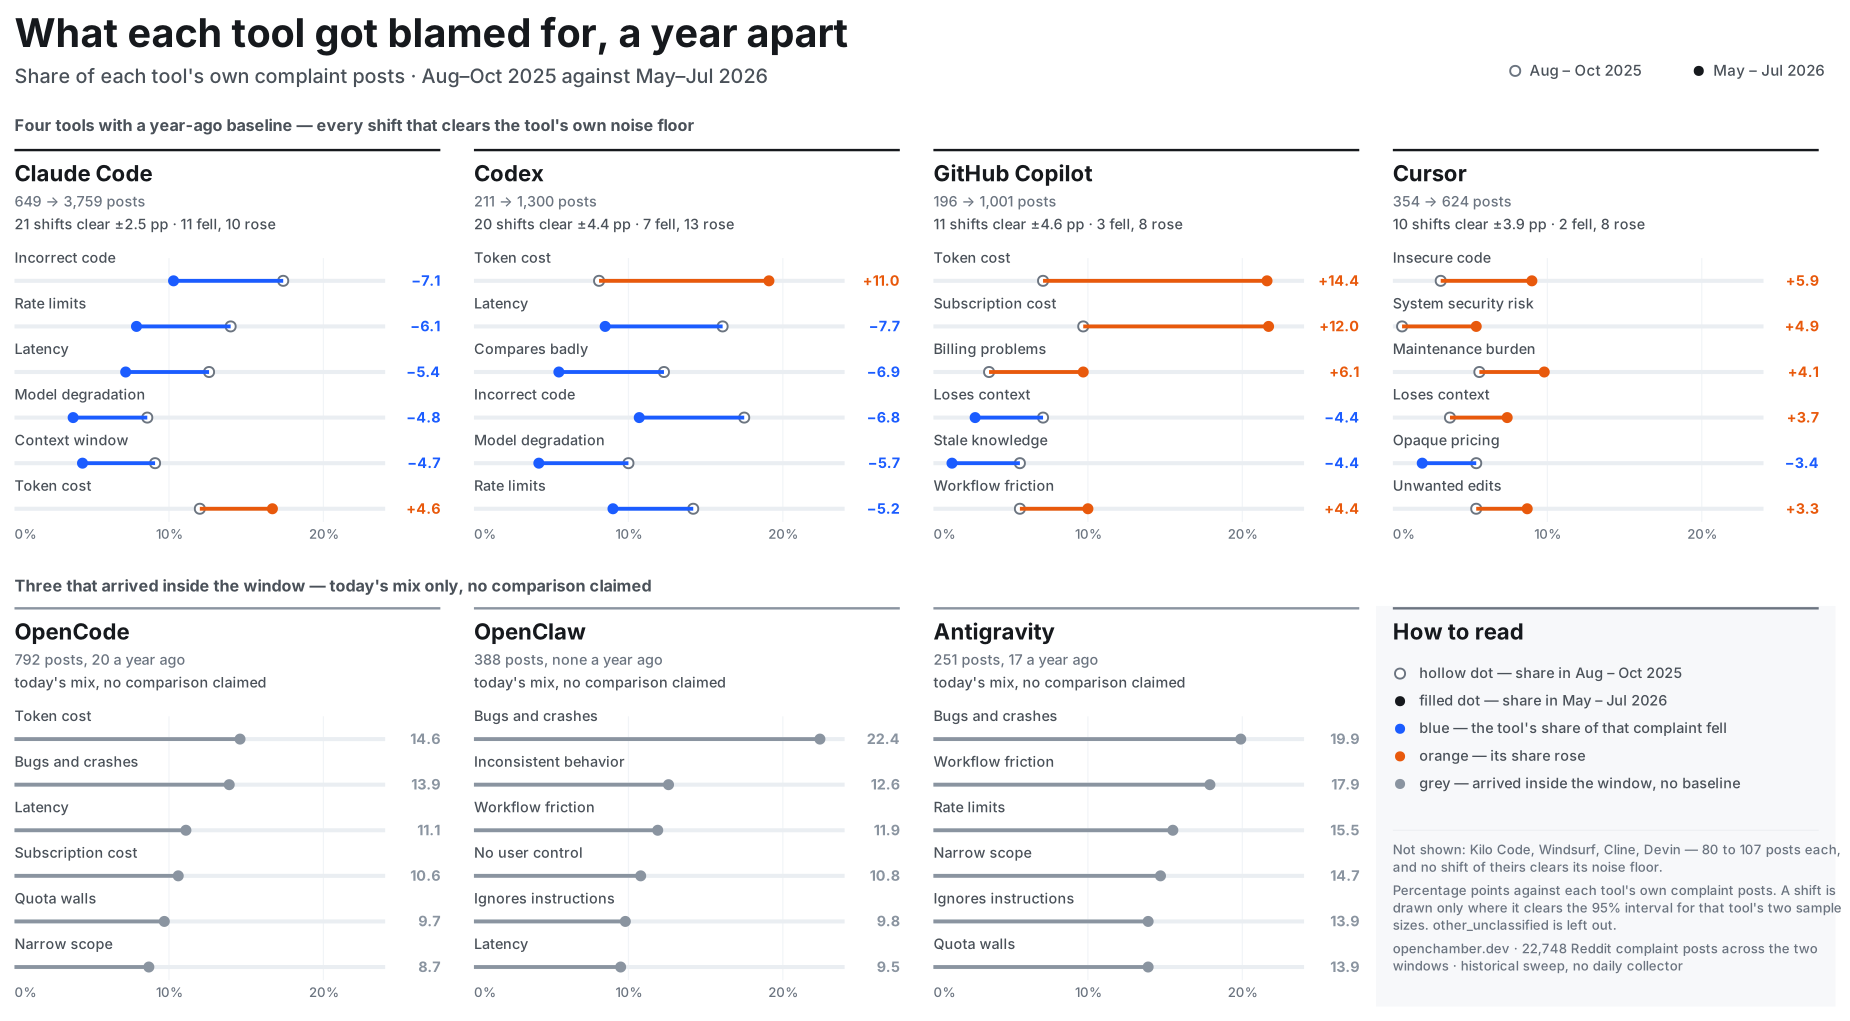
Claude Code: from limits to consumption
649 complaint posts in the early window, 3,759 in the late one. Noise floor ±2.5 pp. Twenty-one movements clear it, eleven down and ten up; the eight largest are below.
| Complaint | Aug-Oct 2025 | May-Jul 2026 | Change |
|---|---|---|---|
| Incorrect or buggy code | 17.4% | 10.3% | -7.1 pp |
| Strict or aggressive rate limits | 14.0% | 7.9% | -6.1 pp |
| Slow response or latency | 12.6% | 7.2% | -5.4 pp |
| Model degradation over time | 8.6% | 3.8% | -4.8 pp |
| Limited context window | 9.1% | 4.4% | -4.7 pp |
| Excessive token consumption | 12.0% | 16.7% | +4.7 pp |
| Unfavourable comparisons with other tools | 7.7% | 4.1% | -3.6 pp |
| Rapid credit depletion or quota walls | 12.2% | 9.0% | -3.2 pp |
Claude Code has the sharpest version of the pattern in the whole dataset. Seven of its eight largest movements are improvements, including a seven point fall in wrong code and a near halving of rate limit complaints. The eighth is the bill for a run, and at 16.7% it is now the tool’s single most common complaint. Further down the list the rises are about safety and manner rather than output: undesirable traits +2.3 pp, security risks from running the agent +2.1, vulnerabilities in generated code +2.1, data exposure +1.8. In the current window, its rate limit complaints are down to 6.1% and quota walls to 5.2%, while workflow friction sits at 19.5%.
Codex: the consumption complaint tripled
211 complaint posts early, 1,300 late. Noise floor ±4.4 pp. Twenty movements clear it, seven down and thirteen up; the nine largest are below.
| Complaint | Aug-Oct 2025 | May-Jul 2026 | Change |
|---|---|---|---|
| Excessive token consumption | 8.1% | 19.1% | +11.0 pp |
| Slow response or latency | 16.1% | 8.5% | -7.6 pp |
| Unfavourable comparisons with other tools | 12.3% | 5.5% | -6.8 pp |
| Incorrect or buggy code | 17.5% | 10.7% | -6.8 pp |
| Model degradation over time | 10.0% | 4.2% | -5.8 pp |
| Strict or aggressive rate limits | 14.2% | 9.0% | -5.2 pp |
| Stuck in loops or repetitive behaviour | 6.6% | 2.8% | -3.8 pp |
| High resource consumption that is not tokens | 0.0% | 3.4% | +3.4 pp |
| Security risks from running the agent | 0.0% | 2.3% | +2.3 pp |
The largest single tool-level movement in the dataset. Codex users complain about the model’s output far less than they did, and about what a run consumes more than twice as much. Its third largest fall is the comparison row: Codex is held up unfavourably against an alternative in half as many complaint posts as a year ago. The two rows that start at zero are not rounding: neither mechanism appears in a single Codex complaint post in the early window. In the current window token consumption is 25.9% of its complaint posts, the highest figure for any tool we track.
GitHub Copilot: it became a billing conversation
196 complaint posts early, 1,001 late. Noise floor ±4.6 pp, the widest in this set. Eleven movements clear it, eight of them rises; the eight largest are below.
| Complaint | Aug-Oct 2025 | May-Jul 2026 | Change |
|---|---|---|---|
| Excessive token consumption | 7.1% | 21.6% | +14.5 pp |
| High subscription or pricing cost | 9.7% | 21.7% | +12.0 pp |
| Billing or subscription problems | 3.6% | 9.7% | +6.1 pp |
| Loses context or short-term memory | 7.1% | 2.7% | -4.4 pp |
| Outdated or stale information | 5.6% | 1.2% | -4.4 pp |
| Workflow disruption or friction | 5.6% | 10.0% | +4.4 pp |
| Lack of pricing transparency | 2.0% | 6.0% | +4.0 pp |
| Steep learning curve | 4.1% | 0.6% | -3.5 pp |
Copilot is the exception that proves the rule about shape. Everywhere else the price row is flat and the consumption row rises. Here both rise, and together they account for 43% of its complaint posts, with a further 9.7% about billing mechanics and 6.0% about pricing that cannot be worked out in advance. Four of its five largest movements are about money. What fell is a mix of memory, stale knowledge and the learning curve, which is what you would expect of a tool that got easier to use while getting harder to pay for. Whatever else changed for Copilot users in the last year, the argument moved to the invoice.
Cursor: security arrived early
354 complaint posts early, 624 late. Noise floor ±3.9 pp. Ten movements clear it, eight of them rises; the eight largest are below.
| Complaint | Aug-Oct 2025 | May-Jul 2026 | Change |
|---|---|---|---|
| Vulnerabilities in generated code | 3.1% | 9.0% | +5.9 pp |
| Security risks from running the agent | 0.6% | 5.4% | +4.8 pp |
| Output maintenance burden | 5.6% | 9.8% | +4.2 pp |
| Loses context or short-term memory | 3.7% | 7.4% | +3.7 pp |
| Lack of pricing transparency | 5.4% | 1.9% | -3.5 pp |
| Aggressive or unwanted changes | 5.4% | 8.7% | +3.3 pp |
| Data privacy or exposure risk | 1.4% | 4.5% | +3.1 pp |
| Missing or incomplete features | 6.5% | 3.5% | -3.0 pp |
Cursor is where the security shift shows up first and hardest. Its three security rows added nearly fourteen points between them in a year. The maintenance row belongs to the same story: code that arrives faster than it can be reviewed becomes code somebody has to keep. Eight of its ten significant movements are rises, and the two falls are about the product getting clearer rather than better: pricing people can understand, features that had been missing.
The newcomers
Two tools had no measurable complaint volume a year ago and have plenty now, which is its own kind of finding. opencode went from 20 complaint posts in the early window to 792. OpenClaw went from zero to 388. Antigravity went from 17 to 251. For all three, the early window is too thin to carry a year-over-year reading: with seventeen posts behind a percentage every shift sits inside the noise, so we report the arrival and say nothing about the shape of it.
One note on how opencode is counted, because it is easy to get wrong. opencode is one product. Go is its paid tier, not a second tool, and neither is the CLI, the web client or the spelling with a space. The extractor records whatever name the author typed, so those land as separate strings; every count here folds them back into one instance.
The difference between the tiers is worth stating, though, because it is the article’s own thesis in miniature. Posts that name the free product complain about a tool: crashes, latency, scope. Posts that name the Go tier complain almost only about the meter — token consumption 19.8% of them, quota walls 15.6%, subscription price 13.2%, rate limits 12.0%, billing mechanics 9.0%, pricing nobody could work out in advance 6.0%. Same codebase, same model, and a complaint profile that belongs to a billing department. The tier was withdrawn in August, which is what the post quoted earlier is about, and those complaints stop with it: three posts in the current window against 167 in the late one.
Universal problems and one product’s hole
If a complaint hits every tool at roughly the same rate, it is a property of the class and switching will not save you from it. If one tool runs two or three times the median, that is a defect of that product. We can now separate the two, using the current window and the eight agents with enough volume in it: Claude Code (2,945 complaint posts), Hermes (1,502), Codex (1,298), opencode (572), Pi (378), Cursor (376), OpenClaw (307), GitHub Copilot (202).
Each of those counts is one instance of the tool, tiers and interfaces included. That matters more here than anywhere else in the article: on the bare product name alone Hermes would be a third smaller, Pi two fifths, and Copilot a tenth.
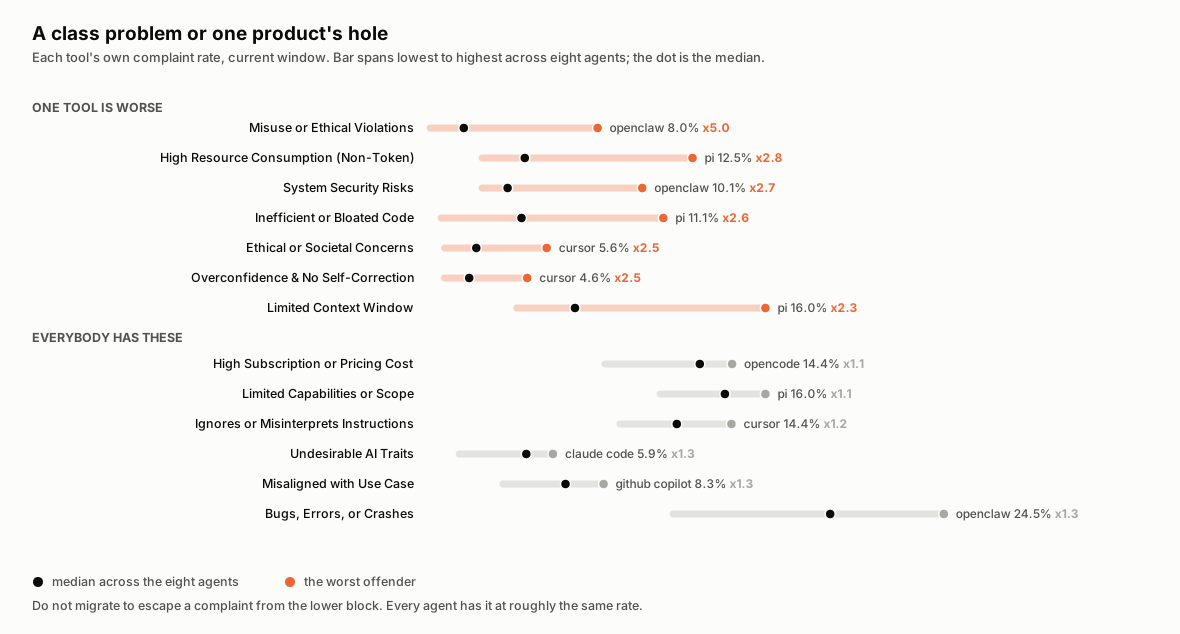
Universal. Everybody has these, within a third of each other.
| Complaint | Median across agents | Range |
|---|---|---|
| Workflow disruption or friction | 17.4% | 8.9% to 24.2% |
| Limited capabilities or scope | 14.5% | 10.1% to 16.9% |
| High subscription or pricing cost | 13.4% | 10.0% to 15.8% |
| Ignores or misinterprets instructions | 12.5% | 8.5% to 15.2% |
| Lack of user control or autonomy | 10.0% | 6.6% to 11.7% |
| Context management overhead | 9.9% | 6.4% to 12.2% |
| Aggressive or unwanted changes | 8.0% | 4.5% to 9.8% |
| Poor UI or UX | 6.9% | 5.4% to 9.0% |
Read that list against the reviews you see. “It gets in the way”, “it is too narrow”, “it is expensive”, “it ignores instructions”, “it cannot be steered” are true of every agent in this market at nearly the same rate. They are not differentiators, and a migration undertaken to escape one of them buys you the migration cost and nothing else. Two more sit just outside the band and are worth naming for the same reason: crashes, with a median of 17.0%, and token consumption at 16.1%, where even the worst offender is only about one and a half times the median.
Product-specific. Somebody is running double the median or worse.
| Complaint | Median | Worst | Multiple |
|---|---|---|---|
| Misuse or ethical violations | 1.5% | OpenClaw 6.2% | x4.0 |
| Vendor lock-in | 1.9% | GitHub Copilot 6.4% | x3.5 |
| High resource consumption that is not tokens | 3.6% | Pi 10.3% | x2.9 |
| Security risks from running the agent | 4.1% | OpenClaw 9.8% | x2.4 |
| Output maintenance burden | 4.4% | Cursor 10.1% | x2.3 |
| Stuck in loops or repetitive behaviour | 6.2% | Pi 13.5% | x2.2 |
| Deskilling or over-reliance | 3.2% | GitHub Copilot 6.9% | x2.2 |
| Underlying model weakness | 2.6% | Pi 5.6% | x2.1 |
A row is here only if the median is at least 1% and the worst offender at least 5%, so that a multiple is never an artefact of two small numbers.
These are the numbers worth acting on. OpenClaw carries an ethics and safety complaint profile that no other agent in the set carries, which follows from what it is: a general-purpose agent wired into chat channels, not a coding tool with a repository boundary. Pi’s cluster is the profile of a young harness under load: resources, loops, a base model people do not rate. Copilot’s lock-in rate and its deskilling row are the two places where its complaints stop looking like everyone else’s.
One caution on this table. A tool with 202 complaint posts has a wide error bar, and the multiples are calculated on the current six-week window rather than on the year. Treat a x2 as a direction to check, not as a verdict.
Where people went
We record a switch when a post states that the author moved from one tool to another and says why. In the historical instrument, the share of complaint posts that contain a stated switch fell from 16.6% in August 2025 to 13.1% in July 2026. The daily instrument reports a lower figure again, but it extracts switches differently, so we do not put those numbers on the same line.
The routes themselves changed more than the volume.
| Early window (Aug-Oct 2025) | Late window (Aug-Sep 2026) |
|---|---|
| Claude Code to Codex (40) | Claude Code to Codex (192) |
| Cursor to Claude Code (28) | Opus 5 to Opus 4.8 (84) |
| Codex to Claude Code (12) | Claude Code to ChatGPT (61) |
| Replit to Rork (10) | Codex to Claude Code (49) |
| Cursor to GitHub Copilot (7) | Opus 5 to Opus 4.6 (38) |
| Windsurf to VS Code (7) | Claude Code to Cursor (31) |
| Lovable to Claude Code (7) | OpenClaw to Hermes (25) |
The busiest route is the same at both ends of the year, and it runs in both directions: Claude Code to Codex, Codex to Claude Code. That is not churn to a winner, it is a two-way street between the two tools people take seriously.
The new entries in the late column are the interesting part. Two of the top five switches are not between products at all. They are between versions of the same model, backwards. Opus 5 to Opus 4.8 and Opus 5 to Opus 4.6 together account for 122 stated switches, and they did not exist as a category a year ago. When users start downgrading deliberately, “which tool” has stopped being the only question. “Which version, at what price, with what behaviour” is now part of it.
What has no name yet
The bucket we cannot classify grew from 9.8% to 13.1% of complaint posts inside the historical instrument, and it stands at 17.3% in the current window, where it is the largest bucket of all.
Part of that is mechanical. The taxonomy has 62 leaves, it was derived from the language of mid-2026, and the newer labelling pass produced a slightly higher rate of out-of-vocabulary answers, 6.5% against 4.4%. That accounts for some of the gap and we say so rather than reporting the difference as a trend.
The rest is not mechanical, and it is the honest limit of this article. When we read the unnamed phrases, a good share of them describe things that did not exist in a form worth complaining about a year ago: skills and their token overhead, subagent fan-out, MCP servers behaving badly at the seams, permission prompts in the middle of long unattended runs, credit accounting across several plans at once. A taxonomy built on last year’s language does not have a slot for those, so they land in “other”.
We would rather report a growing hole than pretend the map is complete. The next revision of this dataset starts by naming what is in that bucket.
The whole taxonomy, in one table
Every complaint is filed under one of thirteen groups. This is the year in full, inside the historical instrument, and it is the shortest summary of the argument in this article.
| Group | Aug-Oct 2025 | May-Jul 2026 | Change |
|---|---|---|---|
| Security and privacy | 6.2% | 9.7% | +3.5 pp |
| Unnamed | 9.8% | 13.1% | +3.3 pp |
| Instruction following and control | 36.2% | 39.2% | +3.0 pp |
| Cost and usage limits | 37.6% | 40.3% | +2.7 pp |
| Performance and speed | 16.7% | 18.5% | +1.8 pp |
| Broader impact and trust | 16.0% | 17.3% | +1.3 pp |
| Support and transparency | 5.6% | 6.0% | +0.4 pp |
| Reliability and stability | 19.2% | 19.2% | 0.0 pp |
| Functional and systemic limitations | 27.6% | 27.5% | -0.1 pp |
| Model evolution and maturity | 8.1% | 7.6% | -0.5 pp |
| Context and memory management | 17.9% | 16.8% | -1.1 pp |
| Integration and user experience | 23.5% | 20.2% | -3.3 pp |
| Output quality and correctness | 49.4% | 44.2% | -5.2 pp |
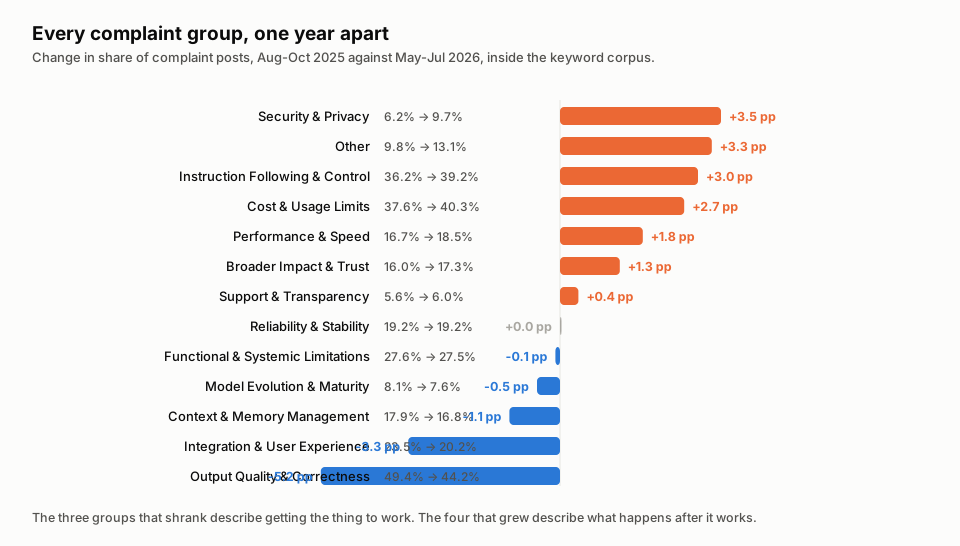
Shares sum above 100% because one post can carry complaints from several groups.
The three groups that fell are the three that describe getting the thing to work and getting good output out of it. The four that rose describe what happens after it works: what it costs, whether you can steer it, whether it is safe to let near your machine, and how fast it burns your resources.
What we take from this
Three things survive every caveat below.
The failure moved from the output to the run. A year ago the agent’s job was to produce correct code, and the complaint was that it did not. Now it mostly does, and the complaint is about what happened while it did: what it consumed, what it touched, what it did while nobody was watching. Wrong code fell from first place to seventh. The bill for a run went from ninth to third.
The money complaint that grew is the one a discount cannot answer. Subscription price is flat to slightly down across the year. Consumption is up by half. Those are different problems with different fixes: one is a number on a pricing page, the other is which model got picked, how much context was re-sent, how many subagents ran, and whether anyone could see it happen while it happened.
Security stopped being about the code and started being about the process. The fastest growing group in the taxonomy is the one about an agent with credentials on a real machine. It is still only one complaint post in ten, and search demand for it is close to nil, so read it as what practitioners have started worrying about rather than as a market that exists today.
The series behind this keeps running. If a number here is wrong, tell us and we will fix it and say what changed.
What this does not tell you
Conversation volume is not market share. A tool distributed inside an IDE most developers already have will generate a different volume of posts than one you install deliberately, at the same number of users.
A complaint count is not a quality score. Shares here are computed within complaint posts, so a tool that is discussed constantly appears constantly. Where we compare tools, we compare the shape of their complaints, not the size.
Reddit is not the industry. It over-represents individual developers, hobbyists and small teams, and under-represents regulated enterprises, which mostly do not post. Our earlier work put company context in only 18% of posts.
The instruments differ, and we have shown by how much. Every year-over-year number here is inside one instrument. The current-window section is ranked rather than differenced for exactly this reason. Where a direction depends on which method you use, it is not in this article at all. That list, for the record, includes latency, subscription price, hallucination, UI quality and misleading marketing: all of them move one way in one instrument and the other way in the other, so we make no claim about their direction over the year.
Labels are machine-made. Phrases are classified by a language model against a fixed taxonomy. On 120 labels drawn at random, a second reading agreed with 102, or 85%. That is a sanity check and not a blind human panel, so treat it as one. The errors run mostly one way: a phrase that is not a complaint about a tool at all gets forced into the nearest leaf, so a fragment about a spreadsheet, an exam or a person ends up filed under a mechanism. That inflates small categories more than large ones. Assume a few points of noise on every number.
August 2025 is a small window. It holds 3,098 complaint posts against 19,650 in the comparison window. The early window is where the error bars live, which is why we use three months on each end rather than one.
Method, and the data
Collection. Two instruments, described above. The historical sweep uses 2,054 keyword queries with eight sort and time passes each, de-duplicated by URL. The daily collector pulls new posts through the Arctic Shift index every morning, and has been running without a gap since 18 August 2026, with a backfill covering 2 August onward. Its last full day here is 20 September 2026.
Extraction. Each post is read by Gemini 2.5 Flash Lite on Vertex against a fixed schema, which returns, among other fields, a list of stated pain phrases in the author’s own words.
Labelling. Phrases are normalised, de-duplicated, and classified into a taxonomy of 13 groups and 62 leaves, plus a layer saying what the complaint is aimed at. For this article we labelled 209,010 distinct phrases from the current window.
Quotes. Every quote in this article is a verbatim sentence from a post that names the tool it is about, picked for fit to the mechanism under discussion rather than for score. That rule deliberately excludes the highest-scoring posts in the corpus, which are jokes and news links from general subreddits: they travel further than anything a practitioner writes, and they are not evidence about a tool.
Counting. Everything is post-level. A post that phrases the same pain five ways counts once for that mechanism. Self-promotional posts, mirror subreddits and reposts are excluded before any share is computed. Shares across categories sum above 100% because one post can carry several distinct complaints.
Windows. Year-over-year comparisons are August to October 2025 against May to July 2026, both inside the historical instrument. The current-window section is 1 August to 20 September 2026, from the daily instrument.
Rounding. Shares are printed to one decimal and every stated shift is the difference of the two printed ends, so a reader can check any row by subtracting. Computed on unrounded shares a few of those shifts land 0.1 pp away; charts built from the same series may therefore differ from a table by that much, and nothing in this article turns on it.
Corrections. If you find an error, tell us and we will fix it and note the change. Every chart in this article is drawn from the same monthly series as the tables beside it, and every number in both was generated by script rather than typed by hand.
How to cite: Dybsky, D., OpenChamber Research, A year of AI coding complaints: what stopped hurting and what took its place, 21 September 2026.
Appendix: the taxonomy
Thirteen groups, 62 leaves. Every complaint phrase in this article is filed under exactly one of them, plus a layer saying what the complaint is aimed at. Two leaves of the original schema, “Inconsistent Performance” and “Inconsistent Reliability”, are merged into “Unpredictable or Inconsistent Behavior” because the extractor used all three interchangeably; that merge is why the count is 62 and not 64.
| Group | Leaves |
|---|---|
| Output quality and correctness | Incorrect or buggy code · Hallucinated information · Inefficient or bloated code · Irrelevant or verbose output · Generic or suboptimal output · Poor code style · Output maintenance burden · Unfavourable comparisons |
| Instruction following and control | Ignores or misinterprets instructions · Lack of user control or autonomy · Unpredictable or inconsistent behaviour · Overconfidence and no self-correction · Aggressive or unwanted changes · Undesirable AI traits |
| Context and memory management | Loses context or short-term memory · Limited context window · Forgets past interactions or files · Context management overhead |
| Performance and speed | Slow response time or latency · High resource consumption (non-token) · Inefficient processing or workflow |
| Cost and usage limits | Excessive token consumption cost · High subscription or pricing cost · Strict or aggressive rate limits · Rapid credit depletion or quota walls · Billing or subscription problems · Lack of pricing transparency |
| Reliability and stability | Bugs, errors or crashes · Stuck in loops or repetitive behaviour · Service downtime or unavailability · Unclear or vague error messages |
| Integration and user experience | Setup or integration difficulties · Workflow disruption or friction · Poor UI/UX or frustration · Steep learning curve · Tooling or IDE incompatibility · Difficulty in customisation or extensibility |
| Functional and systemic limitations | Limited capabilities or scope · Difficulty with large codebases · Missing or incomplete features · Scalability issues · Underlying model or platform weakness · Hardware or infrastructure constraints · Misaligned with use case · Architectural or design limitations |
| Security and privacy | Code security vulnerabilities · Data privacy or exposure risks · System security risks |
| Support and transparency | Poor or absent customer support · Inadequate documentation · Lack of transparency (internal workings) · Lack of community validation or support |
| Model evolution and maturity | Model degradation over time · Outdated or stale information · Perceived immaturity or not production ready |
| Broader impact and trust | Deskilling or over-reliance · Ethical or societal concerns · Misuse or ethical violations · Misleading marketing or expectations · Negative developer sentiment or burnout · Vendor lock-in |
| Other | Other unclassified |
The layer field has six values: the agent itself, the underlying model, vendor commercial policy, the user’s own side, the ecosystem around the tool, and undetermined.